
“Sell in May and Go Away” denotes to a well-known saying in the investing world that has decades of history. The investment strategy splits the calendar year into two halves, May to October and November to April, particularly for the stocks based on the theory that the stock market outperforms in the period starting October to April and underperforms between May and October. By adhering to this investment approach, investors generally tend to avoid holding stocks during summer months while they are on summer holidays.
Historically, “Sell in May and Go Away” investing strategy has its roots in London, England’s financial district. The original slogan was “Sell in May and go away, come back on St. Leger’s Day,” with the latter event denoting a famous horse race in England. Investors in the US also have adopted similar investment strategy by abstaining from investing between Memorial Day in May and Labour Day in September.
Historical data, since 1945, suggests that the S&P 500 Index has recorded a cumulative six-month average gain of 6.7% in the period between November to April compared to an average gain of around 2% between May and October. Additionally, the S&P 500 generally produces positive returns 77% of the time from November to April and roughly 66% of the time from May to October. Figure 1 depicts six-monthly average returns of the S&P 500 index where November to April period have outperformed the May to October by more than 4% since 1970. However, historically May to October returns are still in positive trajectory, which negates the “Sell in May and Go Away” theory.
Figure 1: Six-monthly average returns of the S&P 500 index
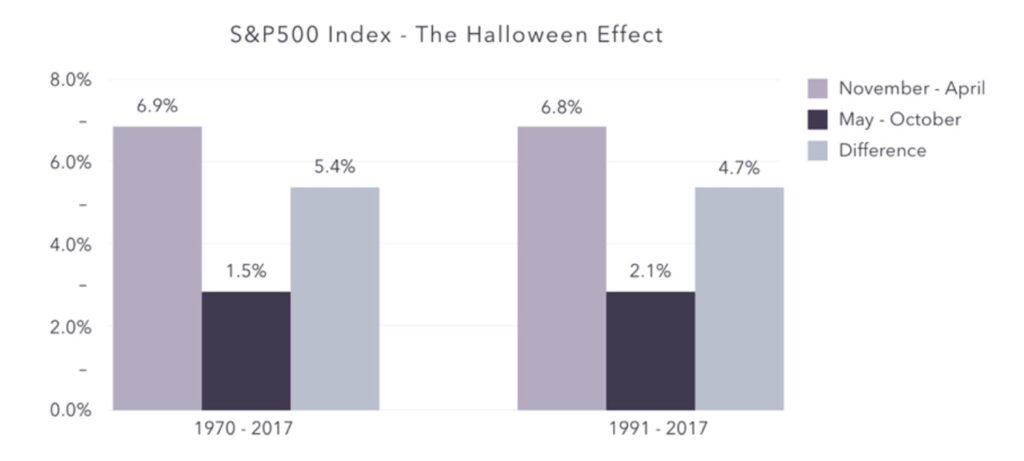
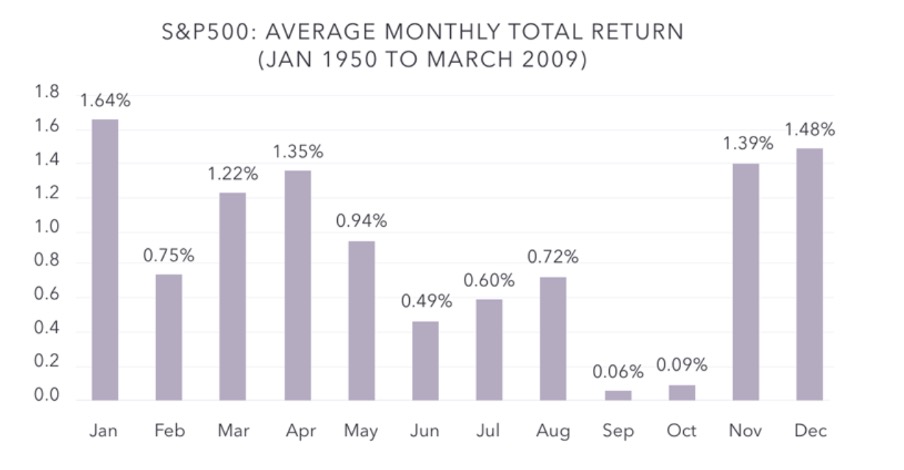
Figure 2 shows average monthly returns of the S&P 500 index since 1950 where months starting from November to April have outperformed those starting May to October. Please keep note that returns are still positive for May to October time frame, although less significant than November to April.
Figure 2: Average monthly returns of the S&P 500 index
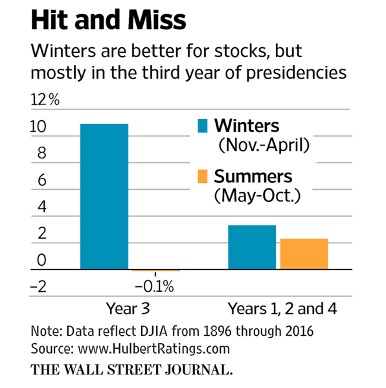
The stock market performance can also be reviewed within the context of general elections. The next year (2024) is expected to be the year of general elections (November 2024 in the US and January/February 2025 in the UK). In the US specifically, historically, year 3 of the presidency has been the best performing year for stocks compared to years 1, 2, and 4, as shown in Figure 3.
Figure 3: Summer vs winter returns during different years of US presidency elections
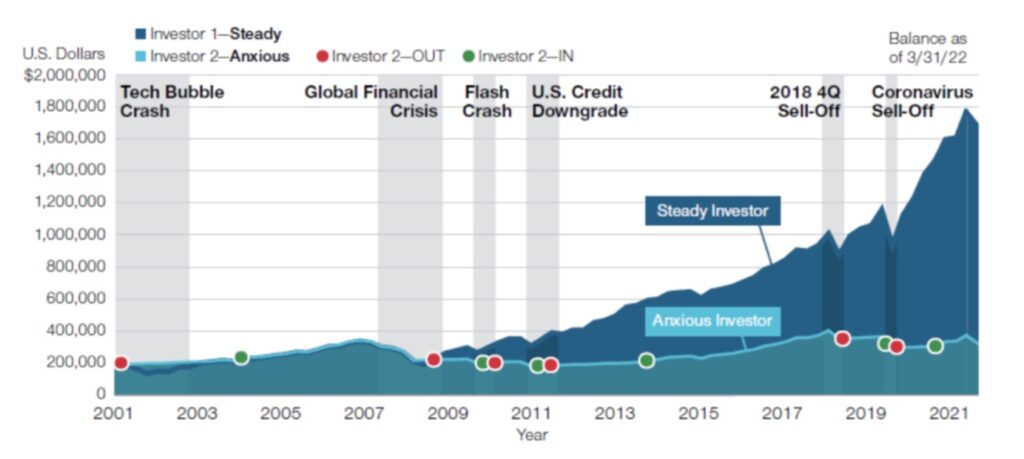
There are alternatives available to the “sell in May and go away” strategy. As markets still generate positive returns, on average, during May to October, therefore, selling in May and going away may not work favourable for long term investors. An alternative could be just “buy and hold” investment strategy. To avoid market timing, trading costs, and missing out the upside in prices during summer months, investors can just be in the market to gain exposure of the upside price movements. Figure 4 highlights that “buy and hold” strategy (investor 1-stready) has significantly outperformed those who tried to get in and out of the market as they think best (investor 2-anxious) over the last 20 years period. This highlights the significance of the major up moves that anxious investors can easily miss out.
Figure 4: Timing the market is a difficult strategy and can be costly
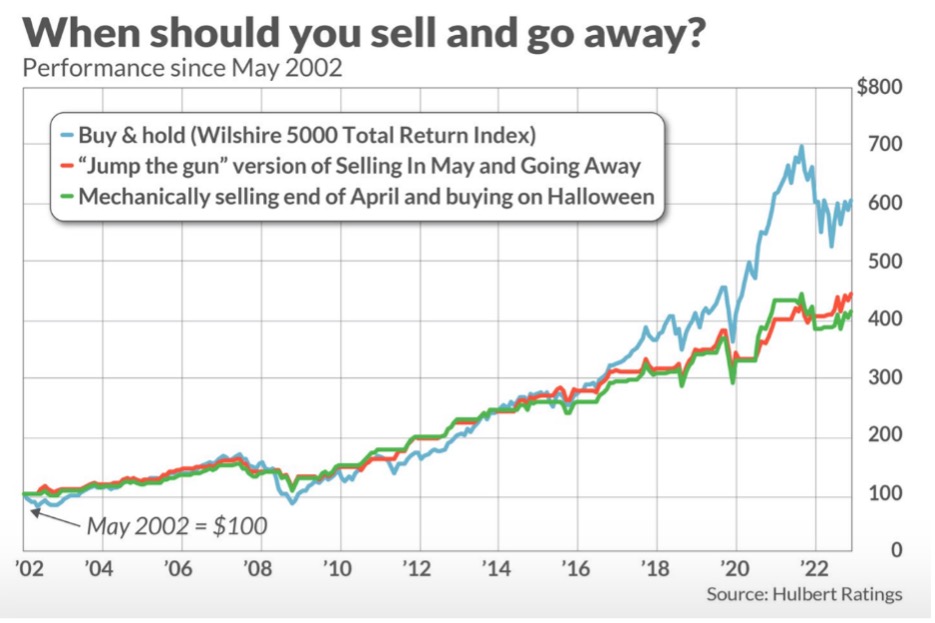
Similarly, figure 5 is another way of looking at “buy and hold” strategy compared to “sell in May and go away” approach. Here again, buy and hold strategy has significantly outperformed “sell in May and go away” strategy over the last 20 years period.
Figure 5: Buy and hold could be a better strategy than calendar-based investing
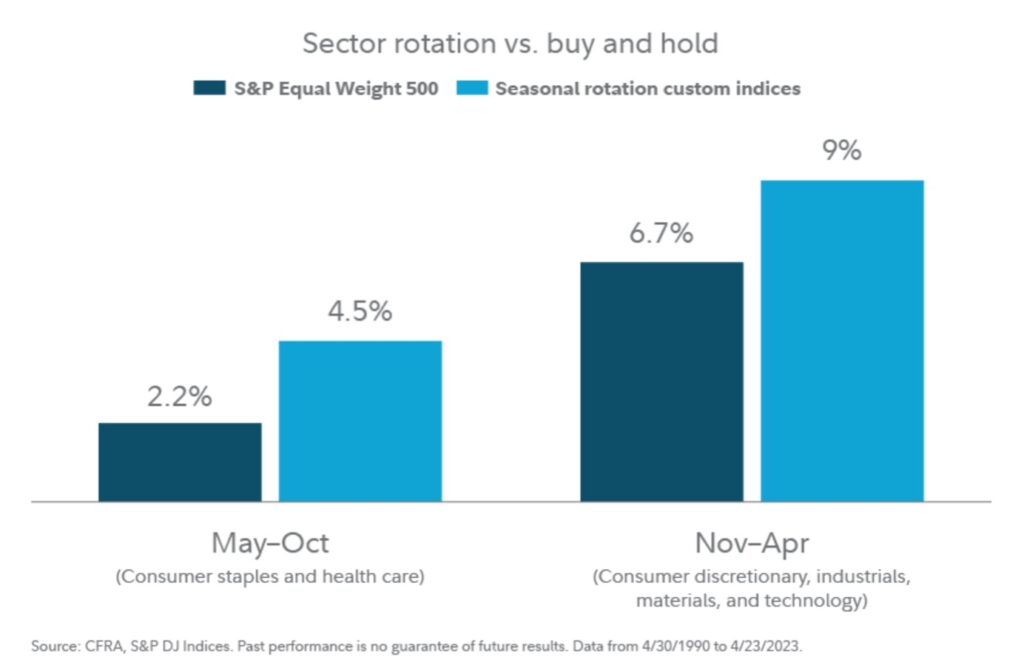
Minimising the investment risk through diversification is a prudent approach to protecting portfolios from significant drawdowns. Another alternative of “sell in May and go away” strategy could be the sector rotation strategy, as shown in figure 6. In summer months, defensive positions (i.e., consumer staples and health care) and in winter months more aggressive positions (i.e., consumer discretionary, industrials, technology) may work favourably.
Figure 6: Sector rotation strategy
In conclusion, some key points to note are as follows:
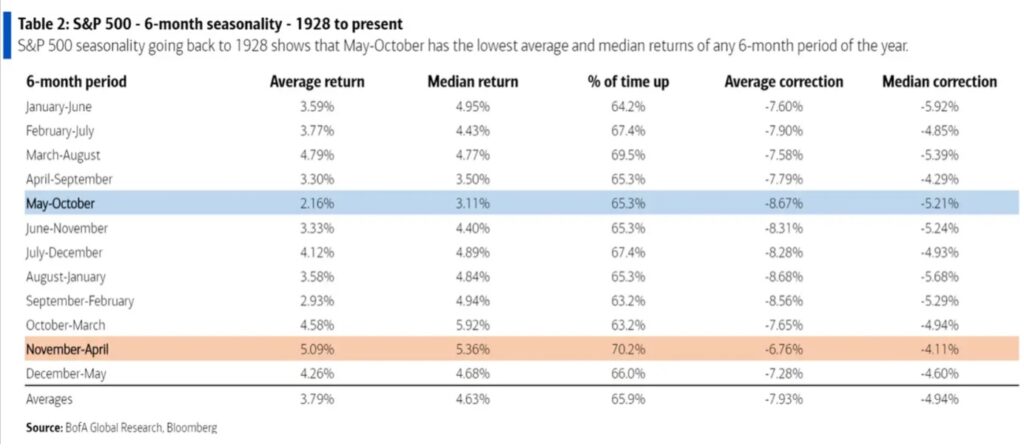
• As shown in figure 7 below, summer months have mostly had positive returns and average returns have been above 2% during May to October (see figure 8), it’s safe to say that being out of the market may not be the best approach, particularly for long term investors.
• Timing the market can be costly as trading costs (commissions, spreads) need to be considered.
• You can play bit tactically if you have valid reasons: looming recession, threat of war, etc.
• However, you cannot afford to sell in May and go away fully. Being in the game somehow potentially allows you the exposure to the upside movements.
• Remember the biggest enemy of money – inflation. Not earning returns could diminish the purchasing power of money. Inflation is a hard reality, we all are facing, we all know it.
• Stocks still have positive returns in May to October time bracket, though less positive than Nov to May returns. Markets go up about 70% of the time during November to April and 65% of the time during May to October. Therefore, the probability of positive returns is higher than the probability of negative returns.
• Selling in May could increase your cost basis when you return to markets in November as asset prices might have gone up, whatever the growth who knows.
• You can play tactically by shifting from equities to sukuks, gold, or commodities if you think they might perform better than equities during that time period. Essentially you remain invested, although the asset allocation may vary.
Figure 7: Summer months mostly have had positive returns
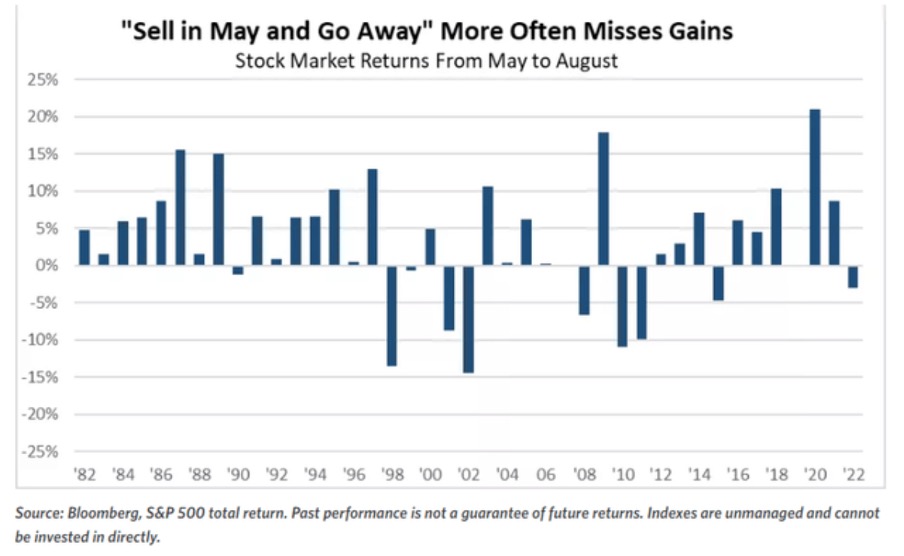
Figure 8: Six-monthly seasonality returns of the S&P 500 index
To learn more about how we can help you, book a free initial consultation with one of our Financial Advisers.
Disclaimer
This article is for information only. Please do not act based on anything you might read in this article. Past performance is not a reliable indicator of current or future returns. This article contains general information only and does not consider individual objectives, taxation position or financial needs. Nor does this constitute a recommendation of the suitability of any investment strategy for a particular investor. It is not an offer to buy or sell or a solicitation of an offer to buy or sell any security or instrument or to participate in any trading strategy to any person in any jurisdiction in which such an offer or solicitation is not authorised or to any person to whom it would be unlawful to market such an offer or solicitation.
When you access a shared link of third-party websites, you are leaving our website and assume total responsibility and risk for your use of the third-party websites. We make no representation as to the completeness or accuracy of information provided at these websites nor do we endorse the content and information contained on those sites.